Wednesday 26 October 2011

Majors look set to give back some of their gains vs USD

Today is an important day news-wise: newspapers call it make or break or the Euro. Even if European leaders decide to leverage up, the underlying problem will still remain. The exercise in kicking the can down the road may give them another breathing period but they will not be able to put off the inevitable, imho.
Back to charts, and this is what 4 hourly charts are telling me. GBPUSD seems to have broken down (on metatrader where 4 hour candle ends at noon London time, it has not broken yet while on dailyfx.com net dania charts new 4 hour candle ended at 9.59am, it already has) from ending diagonal pattern which gives me minimum downside target of 1.5840.  To be on the safe side, price below 1.5975 is green light for shorts.
CAD is a buy at 1.0179 to target 1.0245 at a minimum
Overnight, Australian quarterly inflation came in lower and now expectations are for a first rate cut next week by the RBA. AS a result AUD took a hit across the board. AUDUSD has broken down from rising uptrend line though it may still run up to test that trendline which would be a nice short set up. Nevertheless, AUD is likely to fall to 1.0200 at the very least.
AUDCAD also gave back most of the gains of yesterday. I am trailing the stop loss below MAs and the uptrend line on 4h charts. So, the new stop is 1.0429.

Tuesday 25 October 2011

Another Trade Idea

There is one set-up I like to call crocodile claws: it is when a price is stuck between 21MA and 50MA or 50MA and 200MA. One is above and another is below or vice versa. Then a price breaks out of crocodile claws and flies away to freedom, to express metaphorically. In terms of direction of the flight, it is either continuation or reversal or flat L. You can see and trade this set up at any time-frame. But it is always good to use this set up in conjunction with some other signal to get the odds on your side.
Four chart of EURJPY shows that the price is 150 pip consolidation range while daily chart of EURJPY shows that it is capped by 50MA from above and 21MA from below. Finally, daily downtrend line has been broken, which by itself is not necessarily a trading signal but at least markets are giving us a cue. Thus, we are getting enough confidence that this pair looks like set up for the upside.

Trading wise, the safest way is to wait for the pair to close above the range (4h chart). Aggressive stop loss is 105.50 and conservative stop loss is 105.00. If it breaks to the upside, the pair may stall at 1.0750/60 level and even fall back down. Should that happen, one has to view it as an opportunity to buy more. The first target is 109.00.
However, if this pair falls back down from the range, it is more likely to fall to 103.50 if not 102.60. But beware, 10460/70 level, where daily 21MA or 4 hourly 200MA (red) are, will act as a support. Then, the price first falls to those moving averages, bounces back to the range where a short can be initiated, and then it falls back down. Daily close below 21MA will confirm the move down.   

Update on AUDCAD

Entry order hit at 1.0468. Original stop below the range has now been moved to 1.0405, just below 50MA and an uptrendline on 4 chart.
As expected, this pair has stalled above 1.0500 area peaking at 1.0539. To be clear, the pair is still within a daily/weekly congestion area and a stall on that area is logical. However, daily RSI is diverging (left section of the first chart) and if you zoom in at a 4h chart, you will notice that a min target of channel extension appears to have been met and the pair came back down with a perfect bearish Shooting Star.


In terms of fundamentals, expectations are for the RBA to cut interest rates as the local economy slows down. The only impediment to rate cuts has been higher inflation. If it slows, the RBA cuts and AUD therefore weakens. Tomorrow (Wed) 1:30am London time, latest inflation data is on dock. Mean forecasts are for a slight slowdown in inflation. If inflation slows faster, the stop loss will most likely be hit as AUD tanks. But if inflation prints as expected or even higher, ahead we go is the motto for AUDCAD, I guess.
I mentioned to many negatives for this trade but that is OK with me. When everything looks bad is the time to do the opposite and in my experience I have seen a lot of breakouts from the range when price consolidates for a few days just beneath the top of the range only to power ahead and never look back for the next few weeks.
Therefore, the recent daily channel/consolidation may serve as a harbinger of the large measured move to come. Unless proven wrong (stop loss being hit), I am willing to give this trade a leeway to prove itself.

Sunday 23 October 2011

Trading multiple time frames

 On my last Wednesday post i shared a trade idea on USDCAD. In short my trade idea of imminent USD strength was right-ish  but I still lost money on this trade because I was early. So, I thanked the market for stopping me out and started watching 1h and 4h charts for signs of reversal. Finally on Monday 17 Oct,  AUDUSD reversed after testing important 
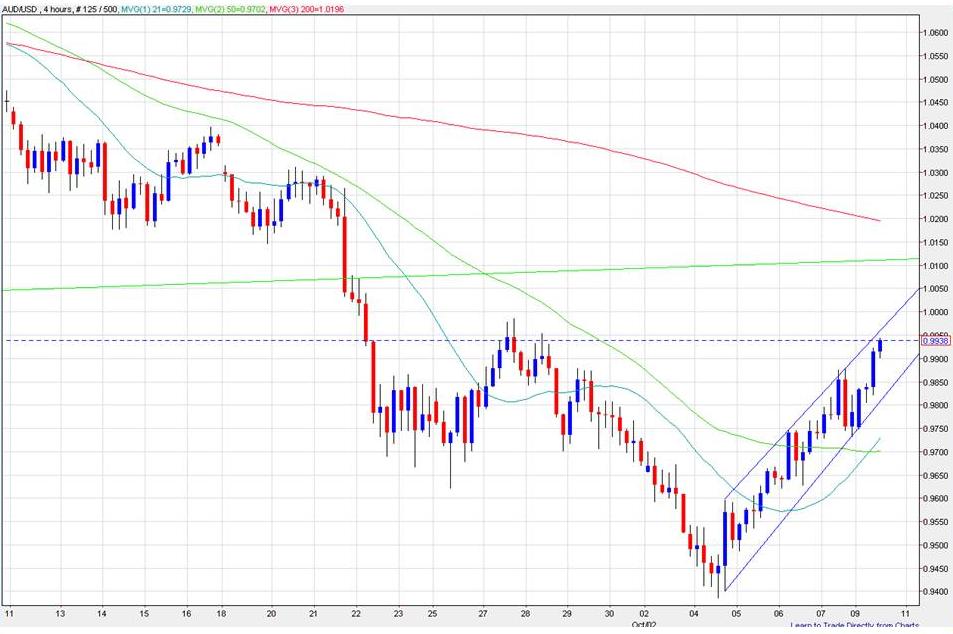
resistance at 1.0345-70 (see the red line on a Daily chart - right section).   The signal came with a shooting star on 4h chart - left section


 I do not normally take trades based on candlesticks because early on I learned that trading based solely on candlesticks will deplete my capital real fast. So, I use candlesticks in conjuction with classical technical analysis (support, resistance, trendlines,etc..). In this case, AUD reversed from major resistance with a bang and that was good enough for me. The target was 1.0118, confluence of 23.6% Fib resistance and daily 50MA (200MA on 4H) which AUD duly reached breaking the short term uptrendline in the process.

The next day i warned about a bounce in majors vs USD which came later in the day (usually I am wrong :) ). First short when AUD came back to test the resistance was a good trade but my tight stop loss was hit. Then AUD tested the trendline once more and only after it was rejected (the first white candle) did I put on the short again. The scenario that I had in mind was ABC correction with a minimum target of 0.9980 and 0.9910 at best. Instead, we had a bullish engulfing candle and consequently I moved the stop loss just above it. When the engulfing candle was followed by an ever tightening range I knew I was now looking at 50-50 trade. Further drill down to 1h showed AUD was in a symmetrical triangle:


 So I moved my stop loss lower and entered reverse buy stop order in case AUD goes up. It then went up and i was now long. I did not wait for it hit the target as implied by the triangle since god knows what will European leaders decided on over the weekend. When AUD reached the green line that was good enough for me.

I do not know what to expect next week re AUD but on a weekly chart we have a bearish Hanging Man while on a daily chart we just made a new high breaking out from the 5 day range. Still, AUD is poking its head at a significant daily resistance. Mixed signals here and so we wait.

LESSON: do use multiple time frames starting from weekly all the way down to 1h to generate a trade idea, to time that idea and to place a stop. If the trade stalls or market not behaving as planned, check shorter time frame ( i usually stop at 1h chart) to decide whether you need to reassess your trade. 

P.S.  Trade idea for the next week. AUDCAD broke to the upside from the 5 day range and it looks it is ready to roll. I would be willing to buy at 1.0468 (above highest high of the range) and put a stop at 1.0360. The only bad news is this pair can stall anywhere betweeen the 1.0515/50 range where previous 3 tops were made.

Thursday 20 October 2011

Moving stops on EUR and AUD shorts

Things are not panning out as expected and EUR and AUD are stuck in ranges

EUR is in 1.3900 - 1.3650 range while AUD is in 1.0360 - 1.0118 range.

EUR short entered at 1.3820 and stop moving to 1.3815.
AUD short at 1.0303. Moving stop to just below breakeven 1.0300

Wednesday 19 October 2011

Tuesday 18 October 2011

Uptrendlines broken

Majors (EUR, GBP, CAD and AUD vs USD) have all broken their short term uptrendlines yesterday. However they are now sitting on their support levels, so I would not be surprised if a bounce ensues


Should Majors bounce versus USD, then these are the levels where shorting them present good reward to risk:

EURUSD could go to 1.3724 which is the neckline of H&S pattern on this 4h chart. Stop 1.3805. Target 1.3570

For AUDUSD, Minimum upside bounce target is 1.0218 . Above that look for it to kiss the broken trendline goodbye which is currently at 1.0275. Stop 1.0318. Target 1: 1.0010 & Target 2 0.9910

USDCAD can go down to 1.0150 or to the broken downtrendline where we can long the pair to the first target of 1.0335.

GBPUSD can go back up to 1.5740 before reversing to the first target of 1.5660. Stop is at 1.5820

At the end of the day, I am only looking for these moves as retraces and not a full blown USD rally. So, at some point I will be looking at shorting USD again, technicals confirming :)


Wednesday 12 October 2011

On loonie

Just noticed USDCAD testing its Sept 27 swing low and is 1.0170 now. It is a good risk reward long USDCAD entry and it also ties up with my view of tactical (minimum a day) USD strength. I am wondering whether a close above 1.0175 on 10min chart will confirm it. Stop loss is 1.0135 and min profit target is 1.0250

Continue to be USD bear

I will post charts later but in the mean time this is what charts are telling me.

Currently I am a USD bear but tactically and in spite of the breakouts on 4 charts I see increasing chances of short term USD strength. In terms of trading it means, reduce USD shorts. Later I will review potential USD short levels where re-establishing USD shorts gives us good risk-rewards.

AUD - intraday price broke thru the daily neckline but with need confirmation on daily basis: AUD should close above the neckline. Then it would be very bullish. However, you may think about taking 50% of profits NOW and the rest at at 1.0170 because strong resistance is on the way and AUD likely to test the neckline before going further up. Stop loss should be moved to 0.9900

EUR - I am not sure it will overcome downtrending 200MA on 4H chart. So, I am halving it. Should it go down, it should be supported at 1.3664, potential buy EURUSD level.

GBP - I re-established long at 1.5650, just above the swing high on 1H chart but GBP is about to meet its 200MA at 1.5785 on 4H chart. My bet like in the case of EUR, it will lose the first fight. Then, it may go back to 1.5675-80, our buy area. Therefore, I am happy to trim as well.

Monday 10 October 2011

EUR breakout

Although we got the overall trend right by turning bearish USD, trading based on an hourly chart has been a bit difficult lately because of whipsaws that followed breakouts from the levels highlighted (see previous post). Only AUD behaved much less erratically.

Anyhow, it is worth keeping in mind trading retracements is more difficult and I guess it is worth following the pairs on a higher timeframe and 4h charts in particular. Second, it is worth selling USD after it rallies rather than breakouts. This is what I will follow for the time being. Now, analysis.

EUR finally broke out falling wedge to the upside. Any return back to 1.3500 to 1.3485 area is a buy. Stop is 1.3360. Resistance: 1.3665, 1.3750, 1.38 (200Ma which is 50MA on dailies) & 1.3880


GBP is on the cusp on double bottom confirmation with a close above 1.5677. Close above it will give us 1.6011 as a target. Resistance: 1.5750, 1.5820, 1.5910/20 & 1.5990. However if 1.5677 holds, we head back to 1.5341 minimum.


AUD - coming out of the V bottom in an uptrend channel. I am not sure it will close above 0.9950 on the first try or above the channel for that matter. One scenario I will be watching out for is that it is rejected at 0.9950 level, goes down to 0.9750 where support holds and then AUD attacks and successfully overcomes 0.9950 level. That will form cup & handle pattern and the target it gives is 1.0450. However, that may be too rich because we have the broken neckline at 1.0035 (currently). We will see


Good luck

Wednesday 5 October 2011

Buy signals

AUD: buy above this triangle


EUR - buy above rising triangle 1.3350 level. First target is 1.3400
Notice, how Euro got back into the channel on 4H


GBP
4h chart shows possible double bottom.
21MA at 1.5490 may slow down but above it GBP is going to 1.5550/60 area, its first resistance area. Then the next target is 1.5675/80

Now, pay attention to rising triangle on 1h, buy above.
Stop losses should be below rising uptrendlines

Good luck


Tuesday 4 October 2011

Short term USD reversals?

I try not to predict but trade what i see and what i see now is this: there appears to be short term reversal patterns on hourly charts of EUR, GBP, AUD & CAD whereby previous swing highs are exceeded. Daily candles are also looking bullish (dojis and bullish hammers so far). So we might be looking for some relief rally.

How long may it last? I do not know but price will tell.

Bought little AUD at 0.9590 & GBP at 1.5474 (prices running away as i write). I think later today they may come back down and if they do, it is worth buying some more. Stops are below lowest lows of today.
Remember to keep positions very small because this is a counter trend rally.

I will post later on targets.

Time to bank our profits

Exit:

Eur at: 1.3165
Cad at:1.0560
Aud: 0.9442

As per previous post we shorted Euro at 1.3620 and added some more at 1.3540. This gives us 455 and 380 pips profit on Euro

Cad shorted at 1.0265 which gives us 295 pips and Ozzie shorted 0.9832 which brings us additional 390 pips.

However, we also lost 50 pips on previous long Cad trade.

Overall, we are up 1470 pips since Monday 26th September. Thank you very much, now beach time, enough trading!