Short at 1.3620 when the pair tested the short-term downtrendline (4hour chart) the 3rd time.
Close below 1.3540 should be heads up to add a bit more to my short.
Ozzie at 0.9832 is a short while loonie is a short at 1.0265.
Wednesday, 28 September 2011
Monday, 26 September 2011
Short-term play: Short CAD
Short (currenctly 1.0300) with a stop loss at 1.0350. We should hit at least 1.0200
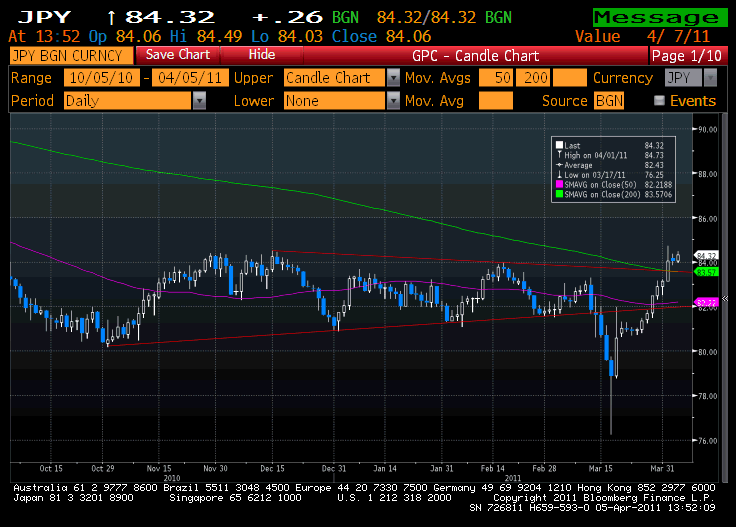
Thursday, 7 April 2011
Short updates
GOLD
Daily RSI is diverging and we have a confirmed doji today: I don't like that. Down day tomorrow? I do not know but based on the triangle or cup&handle conservative target implications, $1481 is the next target level. Target is admittedly far away but it is worth giving this trade more chance to prove itself with the remaining half. Stop at $1.429.
SILVER
The wedge did not hold and silver went right through it but it is sitting on top of the wedge and if it comes back into it, then a down move to $37.37 is possible where uptrendline currently is. Also, the first wave length was $13 (31-18). Extending it from Jan 24 bottom of 26.8, it would make it to $39.8. Current level of $39.6 meets minimal requirements already and at $40 extension requirements will be met fully. Zooming in on 4H chart, close below $39.17 on 4h will confirm short with a stop above recent highs
OIL WTI
After testing patience for three days it has finally rallied today. Provided it is an up day tomorrow, we can move the stop to $107.3 based on three up days rule. Target is $113.5 as per earlier post
JPY
Yen is taking a breather and i will look to enter shorts Yen if retraces a bit more. For USDJPY , 84.26 is a good entry level
EUR
It is at an important junction as it is testing weekly downtrendline. So, nimble is the name of the game till we find out who got the upper hand. 4h close below 1.4239 more likely will lead to a fall to 1.4170/75 area first. One large FX hedge fund is expecting Eur to peak this Friday, retrace for a couple of weeks and then rally all the way to 1.48. As a rule their opinion is not my opinion but it is good to know what big boys are up to.
GBP
It seems to have finally broken its weekly pattern of one week up and the next week down. Even it falls tomorrow, it is likely to remain as the 2nd up week and if it manages to close above 1.6271 this week, then i will look closely whether long entries lasting at least a week should be attempted. Zooming in onto 4h chart, we can see cable at a tight range of 1.6256 - 1.6363. Breakout above or below this range gets us into the trade with the stop on the opposite side of the range and the target being the width of the range. On 4H, MACD and Stochastics have rolled over but cable is at that stage of the trend move when middle of the Bollinger Bands acts as a support and pushes the security further up. I will wait for the range breakout
AUD
This one did not reach my downside target and instead confirmed its bullish uptrend by closing above its 6 month range. However, from Elliott Wave perspective, it is in wave 5 and is topping or has topped. It may indeed be topping but i still think it could rally further, possibly to 1.08 after it dips in the coming sessions. Only if it falls back to its its range, namely 1.01 level will i start to doubt my bullish case. In the mean time standing buy stop order at 1.0230, its previous weekly high sounds reasonable to me. Daily close below 1.0320 will indicate that we are heading to 1.0230 support.
P.S. On 4h charts, indicators are in bearish divergence for EUR, GBP, AUD, CAD and NZD which does not happen so often, or rather happens rarely. USD to rally today? We will find out in a few hours.
Tuesday, 5 April 2011
Yen: major trend reversal at hand
All the research I have read so far suggests JPY should be appreciating. Quick look at charts confirm that: from Jan to May/June 1995 Nikkei 225 fell but JPY appreciated as private sector repatriated money to rebuild the damaged infrastructure. However, repatriations turned short-lived and after only two months outflows resumed while Yen kept appreciating for a couple months more.
Currently, JPY is depreciating confounding all those opinions based on history. I can think of two reasons why yen is appreciating. We can assume that coordinated CB intervention is proving effective or we can assume that markets think that government will deal with the crisis by ordering CB to print Yen instead of repatriations (i.e. currency debasement) or both. I like the latter.
As per my previous posts I was bearish Yen and thought of latest triangle as a reversal rather than continuation pattern. In ¼ of cases triangles come at the end of mature trends. EURJPY also looked bullish to me. When earthquake hit, I did not long JPY at the time because of volatility and of potential CB intervention. I sold on a rally back to the triangle but my stop loss was hit a couple of days later after penetrating into triangle.
One thing I should have noticed but failed to was a bullish hammer which was confirmed the next day. My Netdania charts did not show that unfortunately. So, my loss is a payment for being lazy. Another mistake that I should have considered was that a final selloff in USD took place in thin markets. That should have sent my lights blinking as to the validity of the move. One technicality and one factor that I will keep in mind in future. Therefore, this time I will use charts from Bloomberg since these are the charts that big boys focus on.
My main argument is that JPY has almost bottomed out and multi month base building process seems almost complete. I am still convinced JPY will decline from here and long term targets are at least 95 and then 100. Best risk to reward comes from shorting Yen going forward on any meaningful rally.
Monthly JPY – almost
Last month was a bullish hammer but we need to wait till the end of April for final confirmation. But MACD is in positive divergence and bullish crossover took place

Weekly JPY – almost
Pro:
1. Classical TA – multi month bottom building process appears complete. Higher close this week will confirm double bottom. Also earthquake/radiation sell off closed on higher low.
2. Candlesticks – bullish hammer confirmed.
3. MACD: bullish continuation hook and divergence in place. MACD hooks are very reliable.
Contra:
1. Classical TA – major down trendline form Aug 2008 is nearby and USDJPY needs to close above it to confirm.
2. Weekly 50MA currently at 0.85 is nearby to act as a resistance.

Daily JPY - short
On the break from triangle, JPY reached implied target in three days and now what we have is a pattern failure of sorts. This is a typical triangle reversal pattern. If yen comes back to test around 83.60 (top of the triangle and 200MA), it is a great spot to short it.
EURJPY - as bullish as it can get
Monthly - bullish
We have a bullish hammer (still needs confirmation) and it engulfs 10 previous candles when we compare on a close to close basis. MACD did a bullish crossover as well. In this chart you can see fractal nature of price movements. Quite often you can see a security make a low after a steep fall (Wave 3 in Elliott Wave Theory), then rise up again on profit taking (Wave 4) and then plunge to a lower low (Wave 5) before reversing for good. One can see that in any timeframe. One good example is S&P500 low in Oct 2008 and lower low in Mar 2009. I do not need to tell what happened afterwards.

Weekly - bullish
Multi-month bases building process complete as EURJPY broke up from the flat channel. There are 3 bottoms supported by bullish diverging MACD which finally got above zero. The last time it was above zero was in late 2009. 120 remains a good resistance for the up-move. I do not see any reason why it should not reach its previous high just shy of 140.

GBPJPY – bullish
Monthly - bullish
We have exactly the same story like in monthly EURJPY. This pair is in the process of building a Rounding Bottom. MACD is supportive

Weekly - bullish
Last week was the highest weekly close since Aug 2010. Channel was broken on the upside and MACD is above zero. First solid resistance comes at 141.50 area. Top at 162 is reachable.

AUDJPY
Weekly
Target of 92.85 is feasible and unlike USD, EUR and JPY, AUD pays a good carry as well

P.S.
Although USDJPY has not confirmed short Yen idea yet, what I have at hand is good than enough for me to short Yen. I would not be buying any of these pairs right now as they are deeply overbought and instead will be waiting for dips to buy. I will update on those opportunities as they arise.
Post update or P.S.2:
Market commentators cite rising rate expectations in G7 as the reason Yen is getting trashed and that sounds reasonable enough.
Post update or P.S.2:
Market commentators cite rising rate expectations in G7 as the reason Yen is getting trashed and that sounds reasonable enough.
Sunday, 3 April 2011
Shiny Metals & Black Gold Update
Gold Spot
There are contradictory signals coming from weekly candlesticks versus daily classical TA based on. On a weekly chart we had a bearish shooting star followed by doji. So candles warn longs to be careful here. Weekly MACD and RSI are diverging as well.
However, there is a bullish ascending triangle developing on a daily chart. While MACD and RSI are diverging, I would rather trade based on the pattern at hand than divergences. My bias for Monday is that it is going to be an up day and a close above $1,437 on 4h should be bullish with 1st target of $1,450, the top of the triangle. Should gold meaningfully break out of this triangle, our big target will be $1,500. Alternatively, a test of the rising trendline is a buy with a stop below $1,410. But close below trendline and in particular below $1,410 means pattern failure and as such 1st target will be $1,390and 2nd target will be the weekly uptrend at approximately $1,380.

Silver Spot
Silver looks strong on weeklies and dailies but I keep watching bearish rising wedge. Given bullish pattern in gold and a new 52-week high on OIL WTI, this contradictory message from silver confuses me. Anyhow, at this stage the best way to trade silver is to sell at the top and buy at the bottom of the wedge. Down the line, we should watch out for silver to break to the downside from the wedge.

Oil WTI
Well, so much for divergences just on Wed and by the end of week MACD had a bullish crossover instead as oil made a new high from cup & handle pattern or a rising triangle if one draws a horizontal line at two tops. Initial target is $113.5. Buy intra-day dips. Stop-loss below $102.6. Most important stop level is $96 which is slightly below daily 50MA.

Wednesday, 30 March 2011
Shiny metals and black gold
Commodities have been in a strong uptrend but every now and then short term counter-trend oportunities come along and they are worth taking. For now, it is wait and see.
Gold
It looks as though a short set up is developing coming days and I am waiting for things fall into place. We have weekly & daily RSI and MACD divergences. There is also weekly bearish shooting star but downside follow through this week is needed for shooting star to be valid.

A daily close up shows gold within what appears to be a rising triangle. Only a close below rising trendline approximately at 1410 will serve as an invitation to short targeting its major uptrendline from Nov 2008 currently around 1380. Till then, we will keep an eye on that daily uptrend.

Silver
An amazing trend so far but a potential short trade is brewing here as well. It is within a rising wedge. At this point it is mostly about playing the wedge boundaries but the real deal will be a potential fall from the wedge in April.

Oil (WTI)
It looks like a cup & handle and the target is 105.5+8=113.5 (105.5-97.5=8). But what I do not like is the RSI & MACD divergence and a possibility of pattern failure. Then oil should fall through the steep uptrendline and head to the top of the failed wedge channel as shown with red arrow. So, wait and see approach looks very reasonable to me.

Thursday, 10 March 2011
Usually there is not much to do but today the plate is full
AFTERNOON UPDATE
EURJPY
See the commentary in the previous post. Anyhow, I have two scenarios (details in the chart) and so far I think scenario A may work. However, as you are aware equity markets are tumbling as I write so 1) JPY may catch a risk bid and 2) EUR is likely to tank further below current levels (need to see daily close). Then scenario b would be at play to buy at the bottom of the channel. If both fail, I am wrong and I am out.

AUD - bye bye my friend

NIGHT UPDATE
EURJPY
See the commentary in the previous post. Anyhow, I have two scenarios (details in the chart) and so far I think scenario A may work. However, as you are aware equity markets are tumbling as I write so 1) JPY may catch a risk bid and 2) EUR is likely to tank further below current levels (need to see daily close). Then scenario b would be at play to buy at the bottom of the channel. If both fail, I am wrong and I am out.

AUD - bye bye my friend
A trendline of medium importance (medium term trend) has been broken and right at the top Ozzie makes symmetrical triangle, then makes a fake close above it for a day just to fall back in the next day and out of it today. Such fakeouts are good trading opportunities in themselves because everyone is caught on the opposite side of the move. Most importantly, triangles come as reversals patterns at the end of the long trend in ¾ of cases. The only thing I do not like about this chart is that Ozzie broke out very close to the apex of the triangle and breakouts close to the apex usually fail. Trading Plan is this:
Short: 1.0040 and above. Stop: 1.0140 Target: 0.9550/60 (Nov 29th swing low)
Triangle implied target: 0.9500 (approximately)

NIGHT UPDATE
EUR - short confirmed today
As i wrote previously my scenario B was to play on the short side on rejection of the weekly downtrendline. It appears scenario B is in play as the Euro closed today below an uptrendline from Jan 10th that was part of the rising wedge. So, a further move down to 1.3725/35 support area is what i would expect coming sessions. That level should then produce a short term bounce. In the mean time, any throwback to 1.3845/70 area is an invitation to build additional shorts. Stop is above 1.3924
GBP -another short
This pair also closed below an uptrend from Jan 25th. A move down to 1.5985/95 where it will face Feb 11 swing low and 50MA resistance is what i would expect coming session. If cable closes below 1.5995, then we will be targeting the top of the downtrendline from Nov 4th and Jan 18th which is currently at 1.5885. A bounce to 1.6120 or above is a short opportunity. Stop is at 1.6220.
EURGBP
Today swing high at 0.8550 and a downtrendline at 0.8535 were tested which gave an opprotunity to long. Stop loss is just below 0.8455.
Charts to follow tomorrow....
I wonder whether USD rally will take a breather tomorrow and continue next week instead.
Good luck trading.
Wednesday, 9 March 2011
EURJPY - it seems to be getting ready for the upside
EURJPY made double bottom & finally closed above the entire consolidation pattern on a weekly basis. Does it signify a Major Reversal pattern? IMHO, it can. Since last 4 days it is testing previous swing high of 134.45. I have seen many breakouts whereby currency pair makes 2 to 4 days of dojis at a previous swing high range like EURJPY is doing now and then woosh and there is no turning back. If it happens, I am ready for it. But stochastics are pointing down: daily stochastics has rolled over and weekly is rolling over. Then, a very short term short can be attempted on the breakdown of the current range at 113.40 will be in play to target 113.97 & reverse to long at 113.93.
Charts to follow...
Charts to follow...
Subscribe to:
Comments (Atom)